Difference between OpenVPN, PPTP, L2TP, IPSec
Why SSL VPN?
Does OpenVPN support IPSec or PPTP?
There are three major families of VPN implementations in wide usage today: SSL, IPSec, and PPTP. OpenVPN is an SSL VPN and as such is not compatible with IPSec, L2TP, or PPTP.
The IPSec protocol is designed to be implemented as a modification to the IP stack in kernel space, and therefore each operating system requires its own independent implementation of IPSec.
By contrast, OpenVPN's user-space implementation allows portability across operating systems and processor architectures, firewall and NAT-friendly operation, dynamic address support, and multiple protocol support including protocol bridging.
There are advantages and disadvantages to both approaches. The principal advantages of OpenVPN's approach are portability, ease of configuration, and compatibility with NAT and dynamic addresses. The learning curve for installing and using OpenVPN is on par with that of other security-related daemon software such as ssh.
Historically, one of IPSec's advantages has been multi-vendor support, though that is beginning to change as OpenVPN support is beginning to appear on dedicated hardware devices.
While the PPTP protocol has the advantage of a pre-installed client base on Windows platforms, analysis by cryptography experts has revealed security vulnerabilities.
http://openvpn.net/index.php/open-source/339-why-ssl-vpn.html
http://www.ivpn.net/knowledgebase/62/PPTP-vs-L2TP-vs-OpenVPN.html
Tuesday, February 28, 2012
OpenVPN client - Viscosity on Mac OS X and Windows
OpenVPN client - Viscosity on Mac OS X and Windows
http://www.thesparklabs.com/viscosity/
http://www.thesparklabs.com/viscosity/
Monday, February 27, 2012
windows time sync
1. On the domain controller of the root forest , you may follow the steps to configure the Windows Time service to sync time with the authoritative time source.
a. Open a Command Prompt.
b. Type the following command to display the time difference between the local computer and a target computer, and then press ENTER: (without quotation mark)
"w32tm /stripchart /computer: time.windows.com /samples:5 /dataonly”
Please note:
The Microsoft time server (time.windows.com) uses NIST, the National Institute of Standards and Technology, located in Boulder, Colorado, as its external time provider. NIST provides the Automated Computer Time Service (ACTS), which can set a computer clock with an uncertainty of less than 10 milliseconds. The U.S. Naval Observatory (USNO) Time Service Department in Washington, D.C., is another source for accurate time synchronization in the United States. Many other sites exist throughout the world that you can use for time synchronization.
c. Open UDP port 123 for outgoing traffic if needed.
d. Open UDP port 123 (or a different port you have selected) for incoming NTP traffic.
e. Type the following command to configure the PDC emulator and then press ENTER: (without quotation mark)
"w32tm /config /manualpeerlist: time.windows.com /syncfromflags:manual /reliable:yes /update"
2. The computers that are joined to a domain are configured to synchronize from a manual time source. Please use the following procedure to configure a client computer that is currently synchronizing with a manually specified computer, to automatically synchronize time with the domain hierarchy.
You may follow the steps to configure a client computer for automatic domain time synchronization
a. Open a Command Prompt.
b. Type the following command and then press ENTER:
w32tm /config /syncfromflags: domhier /update
c. Type the following command and then press ENTER:
net stop w32time
d. Type the following command and then press ENTER:
net start w32time
You may also use Group Policy to make all the domain clients to sync time with PDC emulator in the domain.
You may find the Group Policy settings used to configure W32Time in the Group Policy Object Editor snap-in in the following locations:
Configure Global Configuration Settings here
Computer Configuration\Policies\Administrative Templates\System\Windows Time Service
Configure Windows NTP Client settings here
Computer Configuration\Administrative Templates\System\Windows Time Service\Time Providers
More reference:
How to configure an authoritative time server in Windows Server 2003
http://support.microsoft.com/kb/816042/en-us
Windows Time Service Best practices
http://technet2.microsoft.com/windowsserver/en/library/517e74d7-40e9-41bd-93aa-48b610b936321033.mspx?mfr=true
Reference:
http://social.technet.microsoft.com/Forums/en-US/winservergen/thread/96278628-03a1-4b3d-90d9-2208a65a1210/
a. Open a Command Prompt.
b. Type the following command to display the time difference between the local computer and a target computer, and then press ENTER: (without quotation mark)
"w32tm /stripchart /computer: time.windows.com /samples:5 /dataonly”
Please note:
The Microsoft time server (time.windows.com) uses NIST, the National Institute of Standards and Technology, located in Boulder, Colorado, as its external time provider. NIST provides the Automated Computer Time Service (ACTS), which can set a computer clock with an uncertainty of less than 10 milliseconds. The U.S. Naval Observatory (USNO) Time Service Department in Washington, D.C., is another source for accurate time synchronization in the United States. Many other sites exist throughout the world that you can use for time synchronization.
c. Open UDP port 123 for outgoing traffic if needed.
d. Open UDP port 123 (or a different port you have selected) for incoming NTP traffic.
e. Type the following command to configure the PDC emulator and then press ENTER: (without quotation mark)
"w32tm /config /manualpeerlist: time.windows.com /syncfromflags:manual /reliable:yes /update"
2. The computers that are joined to a domain are configured to synchronize from a manual time source. Please use the following procedure to configure a client computer that is currently synchronizing with a manually specified computer, to automatically synchronize time with the domain hierarchy.
You may follow the steps to configure a client computer for automatic domain time synchronization
a. Open a Command Prompt.
b. Type the following command and then press ENTER:
w32tm /config /syncfromflags: domhier /update
c. Type the following command and then press ENTER:
net stop w32time
d. Type the following command and then press ENTER:
net start w32time
You may also use Group Policy to make all the domain clients to sync time with PDC emulator in the domain.
You may find the Group Policy settings used to configure W32Time in the Group Policy Object Editor snap-in in the following locations:
Configure Global Configuration Settings here
Computer Configuration\Policies\Administrative Templates\System\Windows Time Service
Configure Windows NTP Client settings here
Computer Configuration\Administrative Templates\System\Windows Time Service\Time Providers
More reference:
How to configure an authoritative time server in Windows Server 2003
http://support.microsoft.com/kb/816042/en-us
Windows Time Service Best practices
http://technet2.microsoft.com/windowsserver/en/library/517e74d7-40e9-41bd-93aa-48b610b936321033.mspx?mfr=true
Reference:
http://social.technet.microsoft.com/Forums/en-US/winservergen/thread/96278628-03a1-4b3d-90d9-2208a65a1210/
Monday, February 13, 2012
Wednesday, February 1, 2012
Using vim + xdebug to debug php On FreeBSD
Using vim + xdebug to debug php On FreeBSD
Here is the scenario: You have multiple developers logged into a Linux server which is running Apache and PHP using Vim to write PHP code. They’re using error_log and echo statements to debug their code. It takes forever, it’s tedious and can result in bugs from forgotten debug statements. You stare enviously at .NET programmers with fancy debuggers (while you snicker knowing that you edit 10x faster with Vim anyways). But still, you know there has to be a better way.
There is.
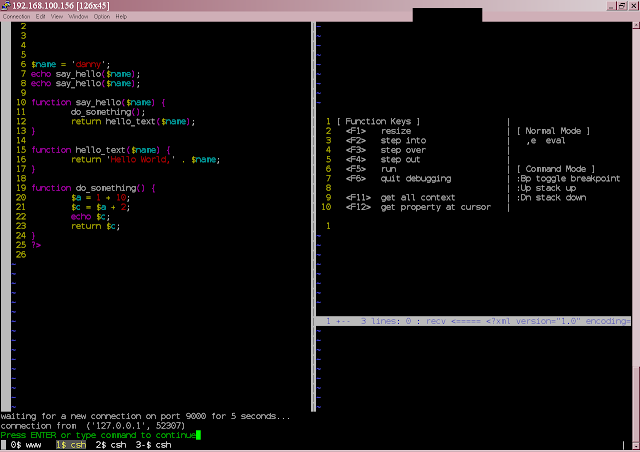
Here’s how it works. You’re coding away in vim. You hit F5; Vim waits for a connection from the PHP server. You refresh the PHP page you’re working on. It attempts to contact Vim — connection successful. You are launched into a debugging session right inside Vim. You can step into, over, and out of statements, eval statements, get all variables in context, get and set properties, remove and set breakpoints, all on the fly. Finally, some real programming tools.
Install VIM
Make sure your VIM supported Python:
# vim --version | grep -E 'python|sign'
If you see "+python" and "+sign" you are good to go.
If you see "-python" and "-sign", please reinstall your vim with WITH_PYTHON=yes option
Install Xdebug client
Now that vim is ready, download the DBGp client script. Extract the two files (debugger.vim and debugger.py) to your vim plugin directory or your .vim home directory
In Vim 7.2 compiled on FreeBSD, the default load-for-everyone plugin location is /usr/local/share/vim/vim72/plugin/, so you would put both files in that directory.
Pick one of clients from:
DBGp client script: http://www.vim.org/scripts/script.php?script_id=2508
DBGp client script: http://www.vim.org/scripts/script.php?script_id=1929
Copy debugger.vim and debugger.py to either one of following directories:
Try to run vim — if you get no errors, everything should be good. If you get an error, double check :version to make sure +python and +signs are there. If they are, post a comment here with the vi error you get. If they aren’t, the vim compilation/installation didn’t work — go back and try it again.
Install xdebug (the server [engine])
Make sure xdebug is loaded by PHP
Now, with your site being example.com, go to http://example.com/index.php?XDEBUG_SESSION_START=1 (Add XDEBUG_SESSION_START=1 after your script name). This will set a cookie in your browser which expires in 1 hour which tells the PHP XDebug module to try to make a connection every time a page loads to a debugging client which is listening on port 9000. The cool thing is that if it can’t make a connection, it just keeps loading the page, so there’s no issue just leaving the cookie on.
Now go back to vim and press F5. You should see a message like “waiting for a new connection on port 9000 for 5 seconds…” at the bottom of the screen. You have five seconds to now refresh the PHP page. This will create a connection between the debugger and client. Now you’re debugging. Follow the instructions in the Help window to step into, over and out of code. Press F5 to run the code until a breakpoint (which you can set using :Bp).
But what if I have multiple developers on the same machine?
No problem. Simply set g:debuggerPort in each developer’s .vimrc to get the client listening on a different port. So if you wanted one developer to connect on 9001 instead of the standard 9000, you would add this line to their .vimrc:
let g:debuggerPort = 9001
Getting the server to connect on a different port is a little trickier. You need to set a custom php.ini value (xdebug.remote_port) for each user. It works best if you’re using VirtualHost’s in Apache. Just add the following line to the VirtualHost section of your httpd.conf:
php_value xdebug.remote_port 9001
Now restart Apache and if you use that VirtualHost and that vi user, then they should connect successfully.
That’s about it
Please post any questions or suggestions you may have. I hope this helps a few of you out there who want debugging tools but don’t want to give up Vim editing. Also be sure to post any alternate methods, or any patches or improvements to the remote PHP debugger vim script, and I’ll be sure to incorporate them.
[Note: This is the first in a series of posts we'll be doing along the lines of tutorials, tools we've developed, tech commentary, and so on. Please feel free to subscribe, as well as leave any comments, thoughts or suggestions below so we can be sure to improve with each article! Thanks!]
use XDebugToolkit to convert the XDebug cachegrind (= “xdebug.log“) to a dot graph
http://code.google.com/p/xdebugtoolkit/
# svn co http://xdebugtoolkit.googlecode.com/svn/tags/0.1.3/xdebugtoolkit/ xdebugtoolkit
# ./cg2dot.py cachegrind.out.23328 > cachegrind.out.23328.dot
# cd /usr/ports/graphics/graphviz ; make install ; rehash
# dot -Tpng -otest.png
Combine to one command:
# ./cg2dot.py cachegrind.out.23328 | dot -Tpng -otest.png
this might be useful /usr/ports/graphics/py-pydot ??
Windows version of Graphviz is also available at:
http://www.graphviz.org/Download..php
[] XDot - Interactive viewer for Graphviz dot files
[] CacheGrind
[] WinCacheGrind (for Windows)
[] CacheGrindvisualizer
[] Graphviz - Graph Visualization Software
[] ZGRViewer - a GraphViz/DOT Viewer
[] Dot Language
[] Scalable Vector Graphics (SVG)
Reference:
How to Debug PHP with Vim and XDebug on Linux
Here is the scenario: You have multiple developers logged into a Linux server which is running Apache and PHP using Vim to write PHP code. They’re using error_log and echo statements to debug their code. It takes forever, it’s tedious and can result in bugs from forgotten debug statements. You stare enviously at .NET programmers with fancy debuggers (while you snicker knowing that you edit 10x faster with Vim anyways). But still, you know there has to be a better way.
There is.
Here’s how it works. You’re coding away in vim. You hit F5; Vim waits for a connection from the PHP server. You refresh the PHP page you’re working on. It attempts to contact Vim — connection successful. You are launched into a debugging session right inside Vim. You can step into, over, and out of statements, eval statements, get all variables in context, get and set properties, remove and set breakpoints, all on the fly. Finally, some real programming tools.
Install VIM
# cd /usr/ports/editors/vim
# make WITH_PYTHON=yes install
# cp /usr/local/share/vim/vim72/vimrc_example.vim ~/.vimrc
Make sure your VIM supported Python:
# vim --version | grep -E 'python|sign'
If you see "+python" and "+sign" you are good to go.
If you see "-python" and "-sign", please reinstall your vim with WITH_PYTHON=yes option
Install Xdebug client
Now that vim is ready, download the DBGp client script. Extract the two files (debugger.vim and debugger.py) to your vim plugin directory or your .vim home directory
In Vim 7.2 compiled on FreeBSD, the default load-for-everyone plugin location is /usr/local/share/vim/vim72/plugin/, so you would put both files in that directory.
Pick one of clients from:
DBGp client script: http://www.vim.org/scripts/script.php?script_id=2508
DBGp client script: http://www.vim.org/scripts/script.php?script_id=1929
Copy debugger.vim and debugger.py to either one of following directories:
/usr/local/share/vim/vim72/plugin
or
~/.vim/plugin
Try to run vim — if you get no errors, everything should be good. If you get an error, double check :version to make sure +python and +signs are there. If they are, post a comment here with the vi error you get. If they aren’t, the vim compilation/installation didn’t work — go back and try it again.
Install xdebug (the server [engine])
# cd /usr/ports/devel/php-xdebug
# make install
# vim /usr/local/etc/php.ini
[Zend]
zend_extension = /usr/local/lib/php/20060613/xdebug.so
; This switch controls whether Xdebug should try to contact a debug client which is listening on the host and port as set with the settings xdebug.remote_host and xdebug.remote_port.
xdebug.remote_enable = 0
xdebug.remote_port = 9000
xdebug.remote_host = localhost
; When this setting is set to on, the tracing of function calls will be enabled just before the script is run. This makes it possible to trace code in the auto_prepend_file.
xdebug.auto_trace = 1
xdebug.trace_output_dir = "/tmp/xdebug/log"
xdebug.collect_params = 4
;xdebug.var_display_max_children = 128
;xdebug.var_display_max_data = 512
;xdebug.var_display_max_depth = 3
; Enables Xdebug's profiler which creates files in the profile output directory. Those files can be read by KCacheGrind to visualize your data.
xdebug.profiler_enable = 1
xdebug.profiler_output_dir = "/tmp/xdebug/log"
; Controls the protection mechanism for infinite recursion protection. The value of this setting is the maximum level of nested functions that are allowed before the script will be aborted.
xdebug.max_nesting_level = 100
; shows a human readable / computer readable trace file.
xdebug.trace_format = 0
; This setting tells Xdebug to gather information about which variables are used in a certain scope. This analysis can be quite slow as Xdebug has to reverse engineer PHP's opcode arrays. This setting will not record which values the different variables have, for that use xdebug.collect_params. This setting needs to be enabled only if you wish to use xdebug_get_declared_vars().
xdebug.collect_vars = 0
; When set to '1' the trace files will be appended to, instead of being overwritten in subsequent requests.
; Note: this option can be useful if you could not find your function calls anywhere.
xdebug.trace_options = 1
Make sure xdebug is loaded by PHP
<?php
echo phpinfo();
?>
Now, with your site being example.com, go to http://example.com/index.php?XDEBUG_SESSION_START=1 (Add XDEBUG_SESSION_START=1 after your script name). This will set a cookie in your browser which expires in 1 hour which tells the PHP XDebug module to try to make a connection every time a page loads to a debugging client which is listening on port 9000. The cool thing is that if it can’t make a connection, it just keeps loading the page, so there’s no issue just leaving the cookie on.
Now go back to vim and press F5. You should see a message like “waiting for a new connection on port 9000 for 5 seconds…” at the bottom of the screen. You have five seconds to now refresh the PHP page. This will create a connection between the debugger and client. Now you’re debugging. Follow the instructions in the Help window to step into, over and out of code. Press F5 to run the code until a breakpoint (which you can set using :Bp).
When I pressed F1, F2, or F3 keys, it toggles the character to either upper or lower case.
To solve this problem, I changed following line:
map <F2> :python debugger_command('step_into')<cr>
To:
map ^[[12~ :python debugger_command('step_into')<cr>
Note: press ctrl-v F2 to generate ^[[12~.

But what if I have multiple developers on the same machine?
No problem. Simply set g:debuggerPort in each developer’s .vimrc to get the client listening on a different port. So if you wanted one developer to connect on 9001 instead of the standard 9000, you would add this line to their .vimrc:
let g:debuggerPort = 9001
Getting the server to connect on a different port is a little trickier. You need to set a custom php.ini value (xdebug.remote_port) for each user. It works best if you’re using VirtualHost’s in Apache. Just add the following line to the VirtualHost section of your httpd.conf:
php_value xdebug.remote_port 9001
Now restart Apache and if you use that VirtualHost and that vi user, then they should connect successfully.
That’s about it
Please post any questions or suggestions you may have. I hope this helps a few of you out there who want debugging tools but don’t want to give up Vim editing. Also be sure to post any alternate methods, or any patches or improvements to the remote PHP debugger vim script, and I’ll be sure to incorporate them.
[Note: This is the first in a series of posts we'll be doing along the lines of tutorials, tools we've developed, tech commentary, and so on. Please feel free to subscribe, as well as leave any comments, thoughts or suggestions below so we can be sure to improve with each article! Thanks!]
use XDebugToolkit to convert the XDebug cachegrind (= “xdebug.log“) to a dot graph
http://code.google.com/p/xdebugtoolkit/
# svn co http://xdebugtoolkit.googlecode.com/svn/tags/0.1.3/xdebugtoolkit/ xdebugtoolkit
# ./cg2dot.py cachegrind.out.23328 > cachegrind.out.23328.dot
# cd /usr/ports/graphics/graphviz ; make install ; rehash
# dot -Tpng -otest.png
Combine to one command:
# ./cg2dot.py cachegrind.out.23328 | dot -Tpng -otest.png
this might be useful /usr/ports/graphics/py-pydot ??
Windows version of Graphviz is also available at:
http://www.graphviz.org/Download..php
[] XDot - Interactive viewer for Graphviz dot files
[] CacheGrind
[] WinCacheGrind (for Windows)
[] CacheGrindvisualizer
[] Graphviz - Graph Visualization Software
[] ZGRViewer - a GraphViz/DOT Viewer
[] Dot Language
[] Scalable Vector Graphics (SVG)
Reference:
How to Debug PHP with Vim and XDebug on Linux
use ctags and vim on freebsd
use ctags on freebsd
There are two ctags on freebsd :
ctags from base system : /usr/bin/ctags
exuberant ctags from ports : /usr/local/bin/exctags
If you are linux programmer (like me), then exctags is what you are looking for.
Install ctags from ports:
cd /usr/ports/devel/ctags
make install clean
Generate tags from current directory:
# cd /src/dir/
# /usr/local/bin/exctags -R
Note: a new tags file will be generated under the current directory.
Generate tags from specified directory and store the tag file to the specified path:
# /usr/local/bin/exctags -R -f /tmp/tags /src/dir/
Let exctags to read *.module file as a php script for Drupal:
/usr/local/bin/exctags -R -f /tmp/tags --langmap=php:+.module.inc /src/dir/
Edit your ~/.vimrc:
" To display the tags for only the current active buffer:
let Tlist_Show_One_File=1
" toggle the taglist window.
" Note: press ctrl-v F6 to generate ^[[17~
nnoremap ^[[17~ :TlistToggle<CR>
"nnoremap <F6> :TlistToggle<CR>
Run this command in your vim:
:set tags=/tmp/tags
Add this line to your ~/.vimrc:
set tags=/tmp/tags
Reference:
http://www.codernotes.com/2011/202/use-ctags-on-freebsd/
There are two ctags on freebsd :
ctags from base system : /usr/bin/ctags
exuberant ctags from ports : /usr/local/bin/exctags
If you are linux programmer (like me), then exctags is what you are looking for.
Install ctags from ports:
cd /usr/ports/devel/ctags
make install clean
Generate tags from current directory:
# cd /src/dir/
# /usr/local/bin/exctags -R
Note: a new tags file will be generated under the current directory.
Generate tags from specified directory and store the tag file to the specified path:
# /usr/local/bin/exctags -R -f /tmp/tags /src/dir/
Let exctags to read *.module file as a php script for Drupal:
/usr/local/bin/exctags -R -f /tmp/tags --langmap=php:+.module.inc /src/dir/
Edit your ~/.vimrc:
" To display the tags for only the current active buffer:
let Tlist_Show_One_File=1
" toggle the taglist window.
" Note: press ctrl-v F6 to generate ^[[17~
nnoremap
"nnoremap
Run this command in your vim:
:set tags=/tmp/tags
Add this line to your ~/.vimrc:
set tags=/tmp/tags
Reference:
http://www.codernotes.com/2011/202/use-ctags-on-freebsd/
GNU GLOBAL 作為分析基礎
GNU GLOBAL 作為分析基礎
by thinker
2 Columns
關鍵字:
coding
最近對程式碼分析 (reverse) 有一些想法,打算做一些小工具。如果從頭打造,大概得花個幾個月以上的時間,而且有許多現成的工具可以幫忙完成部分工作。其中最麻煩的工作大概就是 parse 程式碼, doxygen 已經做了我要的東西,應該直接利用就好了,但 doxygen 卻沒有輸出 raw data 。
本來打算看 doxygen 的程式碼,從中攔截,並輸出我要的資料,但意外中發現 GNU GLOBAL 。 GNU GLOBAL 是類似 ctags 的工具,但提供許多 command line 的命令,可以查詢 symbol 的出處,被 reference 的位置等等,正是我所要的資訊,又是 command line 工具,更易於整合。
雖然和 ctags 相似,但 ctags 只產生 DB ,卻沒有讀取 DB 的 command line 工具,另外 ctags 也沒有產生 reference 的資訊。各方面而言, GNU GLOBAL 都優於 ctags 。
GNU GLOBAL 本身,也提供了 bash 、 tcsh 、 nvi 、 vim 、 less ... 的整合。另外 GNU GLOBAL 也提供將程式碼輸出成 HTML 的功能,並產生 hyperlink 。更詳細的功能,請查閱
Reference:
http://www.codemud.net/~thinker/GinGin_CGI.py/show_id_doc/247
http://www.gnu.org/software/global/global.html
閱讀 C 和 C++ 原始碼的好幫手
閱讀 C 和 C++ 原始碼的好幫手
最近有需求讀 C/C++ 的東西, 試了 ctags, cscope 覺得不理想。問了一下收到許多回應 (G+ 、plurk ), 真是太感謝大家了, 減少入門摸索的時間。
試用的感想如下:
grep
優點: 好上手
缺點: 陽春
安裝: 內建於 Linux
gtags
優點: 可找 caller 和 callee
缺點: 因為索引檔是由 ctags 來的, 會漏東西; 執行方式也有些不便
安裝: 程式很久沒人更新了, 要做一些修正才裝得起來
參照官網指示
make 時看少了什麼 header, 手動補一下 header
然後 make 還是會失敗, 將 gas.py 的 "import as" 改為 "import asm", 下面用到的模組名也要跟著改, as.py 也要改為 asm.py。python 2.6 後 as 是 keyword
編好後將幾個用到的 python scripts 第一行由 python2.4 改為 python
GNU global
GNU GLOBAL - 程式碼分析 - cross reference 的分析工具
http://gala4th.blogspot.com/2009/10/gnu-global-cross-reference.html
ack
優點: 比 grep 容易使用, 省得配合一些 command 過濾檔案, 見官網的《Top 10 reasons to use ack instead of grep.》。而且還有彩色的輸出!!
缺點: 因為沒建 index 的關係, 速度較 id-utils 慢, 我的測試情境要 3s, 而 id-utils 只要 0.006s
安裝: curl http://betterthangrep.com/ack-standalone > ~/bin/ack && chmod 0755 !#:3
id-utils
優點: 速度快, 和測 ack 同樣的情況, 建索引 5.3s, 之後搜尋瞬殺
缺點: 介面沒有 ack 直覺易用, 我寫了個小程式 gj 以 id-utils 為底, 提供彩色輸出和進一步過濾檔名的功能。
安裝: Ubuntu 超容易, aptitude install id-utils
Eclipse CDT
優點: 方便開新視窗看 caller、callee
缺點: 不方便搭 vim 使用 (對 vim 重度使用者才有差); 建 index 有點久, 我的測試情境要數分鐘到十分鐘吧
安裝: 結果這個是我試最久的, 因為不知怎麼建 index。參考官網 FAQ, 建索引前要先設 include dir path。我一直找不到 context menu, 結果它就是左側的那個專案清單。另外 Eclipse CDT 也會漏一些東西, C++ 特別嚴重。
結論
用 Eclipes CDT 方便平時快速跳到定義
輔以 id-utils + gj 確保不會漏東西。之後用一用再視需求來更新 gj 功能。
2011-12-16 Update
Eclipse CDT 的問題有一部份是我設錯, 詳細設法見用 Eclipse CDT 讀 C/C++ 原始碼
張貼者: fcamel 於 下午11:25
標籤: C, C++
10 意見:
Scott TsaiDec 12, 2011 09:30 AM
以需要能找出全部有用到某函式的地方為前提:
1. 純粹 C 而不是 C++ 的 code base, cscope + VIM plugin 很好用
2. Eclipse 與 VIM 見 Vrapper:http://itrs.tw/wiki/IDEs_with_VIM_Emulation
要在 VIM 中方便跳到 search results,我有個奇怪用法:
1. 將 search result 轉成『grep -n 格式』存在檔案 l 中
2. vim
3. :set grepprg=cat\ l
4. :grep
5. :copen
回覆
fcamelDec 12, 2011 10:05 AM
之前讀 python code 時有用過 pycscope + VIM plugin, 相當不錯, 原以為 cscope + VIM plugin 也可適用, 可惜 C++ 的情況滿多不適用的。
http://vrapper.sourceforge.net/features/
沒想到 vrapper 有支援 macro, 這樣應該可用, 明天來試試。很久以前用過類似的東西, 但沒有 macro 用起來不順手
最後的例子沒看懂, 是指要先在 cmd line 用 grep -n 將輸出導到檔名 "|" 中, 再做後面的操作嗎??
回覆
Scott TsaiDec 12, 2011 10:11 AM
Re: 最後的例子沒看懂
若搜群工具可以輸出 "FILE:LINE:...SNIPPET.." 格式,將結果存於檔案中, 再用以上設定在 VIM 中打開就可以像在 VIM 中用內建 grep 一樣,跳到各搜尋結果。
搜尋工具格式不同,則寫 script 或手動轉。
VIM 也有 "grepformat" 參數,但我自己是用上述方法。
回覆
Scott TsaiDec 12, 2011 10:20 AM
為了主題完整性,跟之後讀者分享 grep 顏色輸出設定:
alias egrep='egrep --color=tty -d skip'
alias egrpe='egrep --color=tty -d skip'
alias fgrep='fgrep --color=tty -d skip'
alias fgrpe='fgrep --color=tty -d skip'
alias grep='grep --color=tty -d skip'
alias grpe='grep --color=tty -d skip'
以上可安全的加在 .bashrc 中,
grep 發現 stdout 不是 tty 時就會改回無顏色控制碼的輸出。
來源 glibc maintainer Ulrich Drepper:
http://udrepper.livejournal.com/17109.html
回覆
小鄭Dec 12, 2011 04:16 PM
跟ack一樣的功能,不過用Python寫成,程式碼也蠻易讀。
http://eli.thegreenplace.net/2011/10/14/announcing-pss-a-tool-for-searching-inside-source-code/
回覆
小迪克/MarkDec 12, 2011 06:55 PM
Eclipse漏東西是什麼情況? 試試看把indexer的cache limit調大一點...
By the way, gj還不錯用!! Good Job~XD
回覆
scwDec 28, 2011 02:32 AM
還有一個東西叫 lxr,
http://lxr.sourceforge.net/
我覺得也滿好用的溜
回覆
fcamelDec 28, 2011 07:31 AM
@scw 謝啦, 看起來頗強大的, 明天來試試, 好像是類似 doxygen 的工具?
回覆
Hello WaylingJan 5, 2012 05:30 PM
lxr沒顏色~有點難看
回覆
Scott TsaiJan 5, 2012 05:53 PM
較新的 lxr 替代品是 dxr:
http://dxr.mozilla.org/mozilla/index.html
是以 Clang 為基礎的:
https://github.com/mozilla/dxr
@fcamel: "lxr 好像是類似 doxygen 的工具?"
lxr, Linux Cross Reference, 原本是為了研究 Linux Kernel source code 而寫出來的。至今討論 Linux Kernel 內部 API 時還是很常用。
回覆
===
大家都怎麼追 C++ 程式碼啊? 試了 gtags, 不過來源就是 ctags, 會漏掉很多東西, cscope 也會, 但單用 grep 太慢, 沒好工具的話, 想說自己硬幹一個基於 grep 的 index 小工具
doxygen or Source Insight
Sid666 說 cscope
Dec 09, 2011 - 04:46PM
av. visual assist (誤)
York 說 這得視程式碼規模及你打算投入多少時間來決定
York 說 當然,你追這份 code 的原因也要納入考慮
fcamel 說 YorkJong: 我原本指用什麼工具, 的確也如同解決其它問題一樣, 得視情況調整做法
小迪克/SDK 說 eclipse...
Thinker gtags 可以用 regex, 可以 reverse, 可以 grep
Thinker 不是 ctags 可以比擬的..
Thinker 而 cscope 的功能就和 gtags 差不多..
Thinker 如果你只是想加快 grep,建議你用 idutils, 能為所有的 token 建立 index
Thinker 我都是 idutils 和 gtags 合在一起用.. 一些 gtags 沒辨法分析的東西,可以用 idutils 快速改到..
Thinker 我都是 idutils 和 gtags 合在一起用.. 一些 gtags 沒辨法分析的東西,可以用 idutils 快速找到..
Thinker idutils 裡面包括一個叫 gid 的工具,相當於 grep。但 gid 只能針對單一個 token 做 match,而不是一整行。因此,我都是先用 gid 縮小目標,然後把輸出丟給 grep 再做過濾
fcamel 說 Thinker: 謝啦, 之後來試試, 另外在 G+ 有看到 kcwu 推 ack, 看起來也不錯
google-gtags
Server-based tags serving for large codebases. Clients in python and for emacs and vim
- Comment - Hang out - Share
+3
15 comments
Shaka Huang - 好久沒看 C++ 程式碼了.. Orz
Dec 9, 2011
Kuang-che Wu - 只跟 grep 比的話, +ack 不錯. 不過跟你的需求還是差很遠.
Dec 9, 2011 +2
Chia Hao Lo - +Kuang-che Wu 喔喔, 這東西好用, 該有的不會漏比較重要, 謝啦
btw, 今天才在試 find 的語法, 想少搜一堆不相干的檔案, 但沒找到適合的語法。結果在 ack 的說明裡就看到要怎麼用 find + grep 達到只搜 .cpp 和 .h 的寫法, 原來是 -or 啊
Dec 9, 2011
Yu-Teh Shen - cscope 的確有時會漏... 我也來試試看ack~
Dec 9, 2011 (edited)
Scott Tsai - For large C++ code bases I use Eclipse CDT.
I expect that In a few years, IDEs using libclang based indexers should be pretty sweet as well.
Dec 11, 2011
Yu-Teh Shen - 話說我同事用CDT, 建立index的時候, memory吃到快2g...
Dec 11, 2011
Yu-Teh Shen - 話說 +Scott Tsai 你平常debug是用vimgdb還是用甚饃方式使用gdb? 不會是直接用gdb吧...
Dec 11, 2011
Chia Hao Lo - +Yu-Teh Shen 現在記憶體超便宜的, 吃 2G ram 不算是問題了
Dec 11, 2011 (edited)
Chia Hao Lo - +Scott Tsai 之後都來試看看, 那一個用起來最順手 Eclipse CDT, ack, ID Utils
Dec 11, 2011
Scott Tsai - @Yu Teh Shen:
1. 最常用的方法真的是『直接用 gdb 』,最有用的指令還是 backtrace
2. 我後來把 gdb script 語法和 gdb 的 Python API 學了一下。比較複雜的動作寫到 "gdb -x SCRIPT" 裡面
3. 有時直接在程式碼中加入 break point: https://github.com/scottt/debugbreak/blob/master/debugbreak.h
4. 有時切到 gdb-tui: http://davis.lbl.gov/Manuals/GDB/gdb_21.html
Dec 11, 2011
Scott Tsai - @Yu Teh Shen: re: Eclipse CDT Indexer 用很多記憶體:
我會改 eclipse.ini 中的 -X ,讓 JVM 一啟動就 alloc 4 G
公司配給你的電腦太爛的話,一邊帶自己的去,一邊『提醒』主管記憶體大一點、有 SSD 的話你每天可以省 15 ~ 60 min 。
Dec 11, 2011 +1
Yu-Teh Shen - +Scott Tsai 剛剛試了一下gdb -tui, 如果你要編trace code一邊debug, 這樣似乎你可能還是要另外開一個terminal 看code (因為要跳來跳去)?
Dec 12, 2011 (edited)
Scott Tsai - +Yu Ten Shen: 基本上對。詳細一點說:
我開發 C/C++ 程式的方法,刻意避開了『很依賴 debugger』的風格。
多數會先擬好除錯計畫,在 code base 中插入好檢查、pretty print 資料結構的程式才開始。在除錯時,不只是另外開 editor 看 code,同時還有除錯計畫的筆記,紀錄如『我懷疑哪些資料有壞掉』,『已經作過哪些實驗』、『目前看到的 corruption 在 stack 還是 heap 上 address 某某附近』等。
除錯到一半,覺得問題不容易解時,我也會先 trace code 把局部的 data flow 與 control flow 寫在筆記裡面才繼續開始除錯,避免要『跳來跳去』看 code。
在處理複雜的 code base 或長時間執行的系統軟體時,上述風格頗有道理 -- 最重要的是逼自己先分析問題,而不是先開始單步執行然後見樹不見林。如concurrency 的問題不適合用 debugger 觀察、最佳化編譯的 release build 中,你要看的變數原本已經沒用到的話,暫存器已被拿來存別的值了。
我也同意有經驗的 developer 看較簡單 code base 時,直接在 debugger 邊跑邊讀 code 可能比較快。最極端的如大學『C 程式語言入門』助教改作業。但我在工研社教了多屆 C 入門,也是除了分析 core dump 以外,不用 debugger 的。因為學生人數少,看他們的 code 可以教的更深入。
也有遇過很需要 debugger 的時候:編譯或連結時間很長的 C++ code base 要改 code 追特定問題成本太高 (header only style 的 C++ 配上 binutils 中舊的、非 gold 的那版 linker 就很慘了)。我會盡量將 break point, watch point, 檢查與dump 資料結構的動作寫成 gdb script 或從 Python 用 gdb API,避免在 debugger 中重複同樣操作。
結論:
我同意直接用命令列的 gdb 比起用整合在 IDE 中的除錯界面,開發者要多記住很多資訊,有時感覺起來像多餘負擔。最後,整合 gdb 的 IDE 中,Eclipse CDT 與 QtCreator 是支援 remote debugging (包含 cross debugging)且有好的團隊在維護的;但我平常還是覺得從命令列用 gdb 比較快。
Dec 12, 2011 (edited) +6
Chia Hao Lo - 可惜 +1 只能按一次啊~~
Dec 12, 2011
Yu-Teh Shen - +Scott Tsai 感謝你的分享, 我來我的wiki上面開個scott 專區好了~
Reference:
http://fcamel-life.blogspot.com/2011/12/cc.html
https://plus.google.com/111353793049965752735/posts/GAVtr4HXXc4
http://www.plurk.com/p/eyqy5v
GNU GLOBAL - 程式碼分析 - cross reference 的分析工具
GNU GLOBAL - 程式碼分析 - cross reference 的分析工具
by thinker
2 Columns
關鍵字:
程式碼分析
GNU GLOBAL 是類似於 ctags 的工具,用以建立 source code 符號定義位置的 database 。除了符號定義之外,global 還建立符號 xref (cross reference) 的 database ,用以快速查詢 xref 的位置,是個很方便的設計。
查詢 xref 位置的功能,讓使用者能很快的得知何處使用某個指定的符號,可用以確定符號名稱更改時,是否有漏網之魚。或者,也可透過 xref ,以了解符號在系統中的作用、角色。
除了建立 tag 和 xref database 之外, global 提供將程式碼轉成 HTML ,並依 xref 產生 link 的能力。然而,這方面的功能, doxygen 應該更為成熟,輸出的結果也更為美觀。
除此, global 還提供 vim 、 nvi 、 emacs 甚至是 bash 和 less 的查詢介面。透過 editor 查詢的功能就不用說了,和 bash 整合,提供簡短的指令,能快速的查詢、瀏灠程式碼。例如:
[/usr/src/sys] x main
> 1 main 70 alpha/alpha/gensetdefs.c main(in
2 main 1500 alpha/alpha/ieee_float.c main(i
3 main 227 boot/alpha/boot1/boot1.c main()
[/usr/src/sys] show 3
(Load editor and show boot/alpha/boot1/boot1.c at line 227.)
這個範例是在 bash 下,查詢有哪些位置定義了 main function ,查詢的結果列出了三個 main function 。接著 show 第三個 main function 的內容,也就是執行 editor (vi 或其它) 顯示該段程式碼。除此之外,還提供 bash 下的 bookmark 等等的功能。
至於 less 的整合,也提供了一些有趣的功能。例如:
$ less -t main
main(int argc, char **argv)
{
int i;
.....
[xxx/main.c (tag 1 of 55)]
執行 less 以顯示 main function 的內容。
我之所以介紹 GNU GLOBAL ,是因為我在最近的程式碼分析研究當中,以 global 為基礎,對程式碼的 cross reference 進行分析。分析的結果,能幫助我們了解 module 在系統中的作用和關聯性。這對經常在看別人程式碼的 open source 的 programmer 非常的重要,在不確定 module 的關聯性時, programmer 往往是處於傍偟和猶豫當中,遲遲不敢動手。 cross reference 的分析工具,讓 programmer 快速掌握 module ,減少猶豫的尷尬階段。
Reference:
http://heaven.branda.to/~thinker/GinGin_CGI.py/show_id_doc/258
Subscribe to:
Posts (Atom)